Marriages Are Strong in South Dakota and Iowa
What a difference a century or so makes.
Up until about 100 years ago, South Dakota, and Sioux Falls specifically, were known as the 'divorce capital of the nation', thanks to the state's lenient residency laws and multiple allowable divorce grounds.
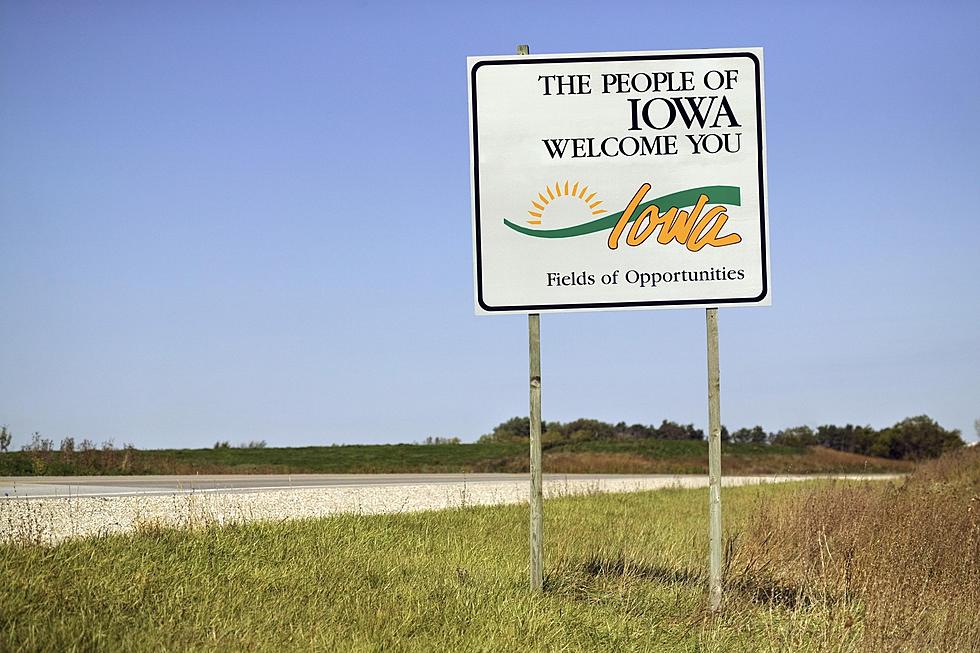
But now, the Mount Rushmore State, and neighboring Iowa, are home to some of the best marriage stability in America.

READ MOIRE: Did you Know That South Dakota Used To Be The Divorce Capital Of The US?
CNBC, using data from the Centers for Disease Control and Prevention, looked at the average duration of marriages from all 50 states and they found some good news.
There were only four divorces for every 10 marriages in the U.S. — a drop of about 20 percent from two decades earlier.
So where are people staying hutched the longest?
Iowa and South Dakota are in the top ten. Marriages in the Hawkeye State lasting, on average, 22 years, while in South Dakota, couples are staying together for an average of 21.8 years.
STATES WITH THE LONGEST MARRIAGES (average duration)
- West Virginia: 22.6 years
- Wisconsin: 22.5 years
- Vermont: 22.4 years
- Montana: 22.1 years
- Iowa, Michigan: 22 years
- South Dakota, Maine, Pennsylvania: 21.8 years
- New Hampshire: 21.5 years
Iowa and South Dakota made the top ten despite having the two youngest median ages for first marriages (SD: 28.45 years of age; IA: 28.65 years of age).
As for the places where marriages aren't built to blast, Washington DC leads the way with an average duration of just barely over ten years (10.5). The next closest place, Alaska, is a distant second.
STATES WITH THE SHORTEST MARRIAGES (average duration)
- Alaska: 16.8 years
- Texas: 17.6 years
- Nevada: 17.7 years
- Utah: 18 years
- Colorado: 18.2 years
- Oklahoma: 18.2 years
- Washington: 18.3 years
- Idaho: 18.6 years
- Georgia: 18.8 years
New York is the state with the lowest percentage of married people (61.29%), while Idaho has the biggest portion of the married population (72.6%).
READ ON: See the States Where People Live the Longest
Gallery Credit: Hannah Lang
11 Bad Laundry Habits to Break Immediately
Gallery Credit: Danielle Kootman
LOOK: 25 things that have different names depending on where you live in the US
Gallery Credit: Andrea Vale
More From KYBB-FM / B102.7


