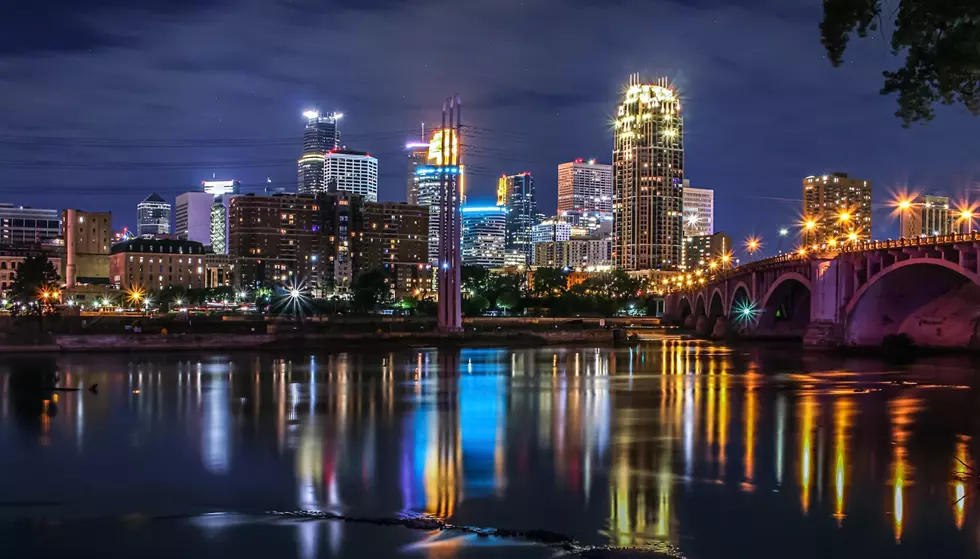
Hotel Room Rates Are Skyrocketing in Minnesota’s Biggest City
There are lots of great reasons to visit Minneapolis any time of the year, but with the holiday shopping season fast approaching and the Vikings' and Timberwolves' seasons in full swing, this is a particularly popular time to head to Minnesota's largest city.
But if you're planning on grabbing a hotel room in Minneapolis while you're there, it's going to cost you.
A lot.

A newly released survey from Family Vacation Guide found that the price of the average hotel room in Minneapolis has gone up a whopping 140 percent just in the past three years.
In 2019, rooms were an average of $177 per night. That average has now ballooned to $425 per night, which is the tenth-highest increase in the nation.
A check of 55 hotels listed at Minneapolis.org for this weekend (November 11-13) found nine properties topping the $400 per night mark, with the Four Seasons Minneapolis going for $1,000 per night.
Overall, the city with the biggest jump in hotel room rates since 2019 is Honolulu.
Rooms in Hawaii's capital city have jumped 252 percent, from $186 per night to an average of $654 per night.
New York City continues to have the most expensive rooms, averaging $743 per night.
BIGGEST INCREASES IN HOTEL ROOM RATES (per night average)
- Honolulu, Hawaii: +252% ($654 average)
- New York City, New York: +226% ($743 average)
- Chicago, Illinois: +200% ($321 average)
- Miami, Florida: +196% ($409 average)
- Boston, Massachusetts: +189% ($488 average)
- Jersey City, New Jersey: +187% ($625 average)
- Orlando, Flordia: +155% ($308 average)
- San Diego, California: +154% ($416 average)
- Las Vegas, Nevada: +144% ($268 average)
- Minneapolis, Minnesota: +140% ($425 average)
LOOK: See how much gasoline cost the year you started driving
Gallery Credit: Sophia Crisafulli
LET'S GO: The most popular historic sites in America
See the Must-Drive Roads in Every State
Gallery Credit: Sarah Jones
More From KYBB-FM / B102.7


