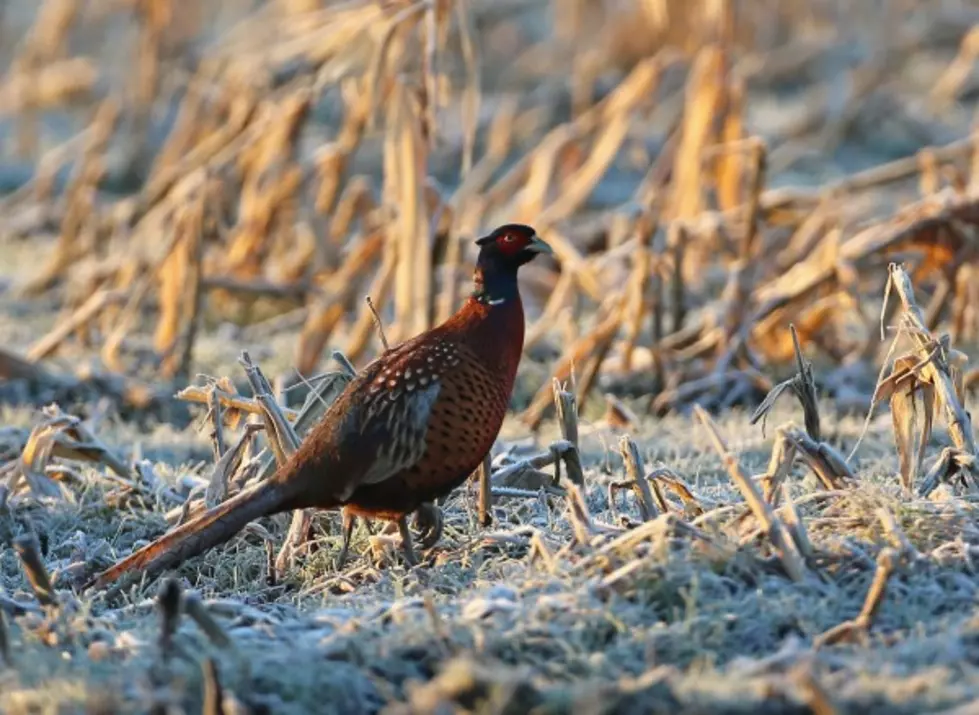
South Dakota Pheasant Numbers Down
South Dakota’s statewide pheasant hunting season opens in October and South Dakota Game, Fish and Parks found that bird numbers are down in the state. Loss of habitat looks to be the leading cause.
GFP's annual pheasant brood survey shows a 20 percent decrease in the statewide pheasants-per-mile (PPM) index from 2015.
“After two consecutive years of substantial increases in the statewide PPM index, a slight retreat was observed this year. Of the 110 routes surveyed statewide, 38 showed an increase in PPM while 72 declined from 2015,” said Kelly Hepler, GFP Secretary. "Weather conditions and available habitat are key factors to pheasant production and annual PPM fluctuations."
Hepler wants to remind hunters that while the numbers were down some, the 2016 season still looks good. "We want to remind hunters that this year’s index is twice as high as the 2013 index and higher than the 2.7 PPM observed in 2014 when hunters harvested 1.2 million roosters. Good pheasant hunting opportunities will exist in 2016.”
Survey results indicate the decrease was significant for the Chamberlain, Winner, Aberdeen, Huron, Mitchell, Yankton and Sioux Falls areas.
“Habitat continues to be at the forefront of the conversation and still remains a crucial factor in pheasant numbers,” stated Hepler. “Bird numbers are higher in parts of the state where quality habitat conditions still exist, primarily on grasslands including those enrolled in the Conservation Reserve Program as well as fields of cereal crops such as winter wheat. We continue to work hard in our Habitat Pays outreach efforts and in cooperation with landowners and partner organizations to provide an improved future for wildlife habitat in our state.”
From late July through mid-August, GFP surveyed 110, thirty-mile routes across the state’s pheasant range to estimate pheasant production and calculate the PPM index. The survey is not a population estimate, but rather compares the number of pheasants observed on the routes and establishes trend information. Survey routes are grouped into 13 areas, based on a local city, and the index value of each local city area is then compared to index values of the previous year and the 10-year average.
More information can be found on the Game, Fish and Parks website.
See Also:
More From KYBB-FM / B102.7
![The Odd Lost and Found of the Buffalo Chip in Sturgis, South Dakota [PHOTOS]](http://townsquare.media/site/486/files/2022/08/attachment-Copy-of-Copy-of-Copy-of-Standard-1600x1067-49.jpg?w=980&q=75)


![LOOK: South Dakota Is Home to World’s Largest Pheasant [PICTURES]](http://townsquare.media/site/481/files/2022/10/attachment-1-22.jpg?w=980&q=75)


